AML Onboarding & VOI

Compliant client onboarding and identity verification

AML/CTF Compliance Centre

Complimentary, all-inclusive AML/CTF solution

Searches and Certificates

Order all your searches and certificates in one place

Property Interface

A dynamic, matter specific environment

Family Law Interface

Manage family law matters with one solution

Wills & Estates Interface

Simplify estate administration and planning

Contract Review tool

Review contracts faster with AI-assisted precision

Settlement Services

Electronically lodge registry documents and settlements

Financial Disclosure

Securely collate client financial documentation

Process Serving

Serve documents fast with tracking

Practice Management Integration

Streamline administrative tasks and optimise workflows

Integration Support Guides

Access our support guides for comprehensive self-help assistance

InfoTrack Connect

Allows suppliers to connect their products and services with the InfoTrack Ecosystem

Next Gen Integration

Learn how software and integrations can transform the way you work

News and Insights

Find out the latest industry updates

AML/CTF Training

Take on compliance with confidence

Events and Webinars

Take your professional development to the next level

Cyber Security Awareness Training

Build your cyber resilience

Property Market Update

Discover leading edge property insights

2025 State of Real Estate Report

Insights from Australian Buyers and Sellers

playbook playbook white logo
Monthly digest covering the latest news for legal and conveyancing industries.

About Us

Learn more about who we are and what we do

Our Team

Find out who drives InfoTrack's innovation and strategy

Join Us

Be a part of our award-winning culture

Media

Featured media releases and mentions

Contact

Get in touch with a member of our team

Awards

Showcasing our people, solutions and service

Discover our award-winning technical innovations.

What do the 2021 Census results reveal?

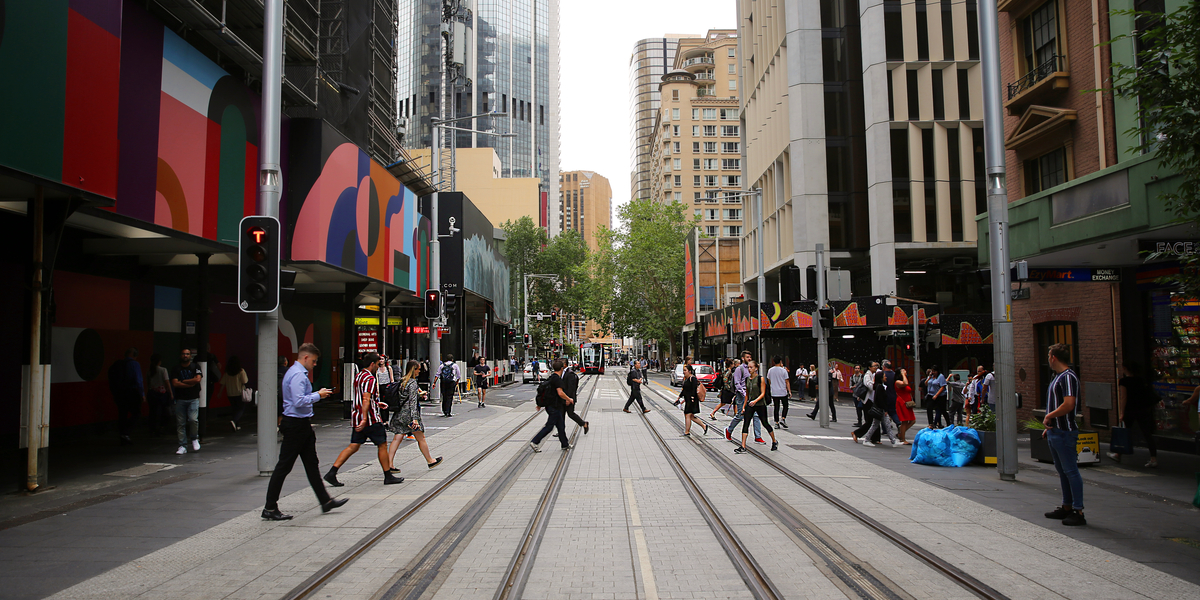
Busy Sydney street

On the 28th of June 2022, key population data relating to the 2021 Census was released by the Australian Bureau of Statistics (ABS). Given that the last census took place in 2016, what seems like an age ago, Australia has witnessed significant changes over the previous five years. 

Key Statistics in a snapshot

Based on the latest data released, we have identified some key statistics that reflect where the nation is currently placed in terms of population, families and households and Australian homes:

  • Almost 80 per cent of Australian residents live in eastern Australia in New South Wales, Victoria, Queensland, and the Australian Capital Territory.
  • 66.9 per cent of people counted were in Greater Capital Cities and 33.1 per cent were in the rest of Australia.
  • 70 per cent were separate houses, 13 per cent were townhouses and 16 per cent were apartments.
  • Two thirds of households (66.0 per cent) own their home outright or with a mortgage.
  • One third of households rent (30.6 per cent).


Note: Owned with a mortgage includes dwellings being purchased under a shared equity scheme. Rented excludes dwellings being occupied rent-free. Refers to occupied private dwellings and excludes visitor only and other non-classifiable households. 

Eastern Seaboard Population shifts

Across the eastern seaboard we saw a steady growth in each state’s population. When comparing 2016 data to 2021, Victoria had the highest period on period growth at 9.73%. However, this does mark a decline in the growth rate, when comparing 2011 census data to the 2016 results where the state showed a period-on-period population increase of 10.69%.

Queensland showed significant growth from 2016 to 2021 (9.63%). It was also the only state on the eastern seaboard that increased its population, percentage wise period on period, from the previous census results of 2011 (8.50%).

  • Queensland: 4,703,193 in 2016 compared to 5,156,138 in 2021 (9.63%)
    • 2016 state population data compared to 2011 (8.50%)
  • New South Wales: 7,480,228 in 2016 compared to 8,072,163 in 2021 (7.91%)
    • 2016 state population data compared to 2011 (8.13%)
  • Victoria: 5,926,624 in 2016 compared to 6,503,491 in 2021 (9.73%)
    • 2016 state population data compared to 2011 (10.69%)  

Unsurprising shifts in all Private Dwellings

The trends identified below are reflective of the current way people are living and the changing conditions of the housing market:

  • Decrease in the average number of people per household, 2.6 in 2016 compared to 2.5 in 2021.
  • Increase in the median weekly household income of 21.42% period on period, $1,438 in 2016 compared to $1,746 in 2021.
  • Increase in the median monthly mortgage repayments by 6.15%, $1,755 in 2016 to $1,863 in 2021.
  • Increase in the median weekly rent (excluding dwellings being occupied rent-free) from $335 in 2016 to $375 in 2021 (11.94%).


Period to period, the average number of children per family has remained consistent at 1.8 for families with children. The decrease detailed above in the average number of people per household could instead be a result of the shift in household composition (occupied private dwellings):

  • Family households made up 71.3% in 2016, decreasing to 70.5% in 2021
  • Single (or lone) person households increased from 24.4% in 2016 to 25.6% in 2021
  • Group Households decreased from 4.3% in 2016 to 3.9% in 2021


The above reflecting a shift in people’s preference, away from family/group households toward single living.

Increases in renting

We have seen a 0.6% increase in occupied private dwellings being rented. The figure went from 30.0% in 2016 to 30.6% in the 2021 census data.
The median rent across Australia has also increased period on period:

  • $340 in 2016 to $375 in 2021 (10.29% increase)
  • $285 in 2011 to $340 in 2016 (19.30% increase)


Additional data yet to be released by the ABS in October 2022 may yield further insights into the changes that Australia has undergone in the past five years.